

Key Insights
- Whale accumulation rises +0.7%, aligning with past price recovery trends
- Bitcoin faces key support at $59,882 and resistance at $98,081
- Leverage flush drops OI by 12%, signaling potential BTC accumulation.
Following Trump’s strategic Bitcoin reserve order, Bitcoin price has dropped more than 5%, which failed to meet market expectations regarding future government Bitcoin equations.
At press time, Bitcoin price was trading at $85,966 with an intraday decline of over 0.33%. Its market cap stood at $1.7 Trillion and the trading volume dropped over 71.20% intraday.
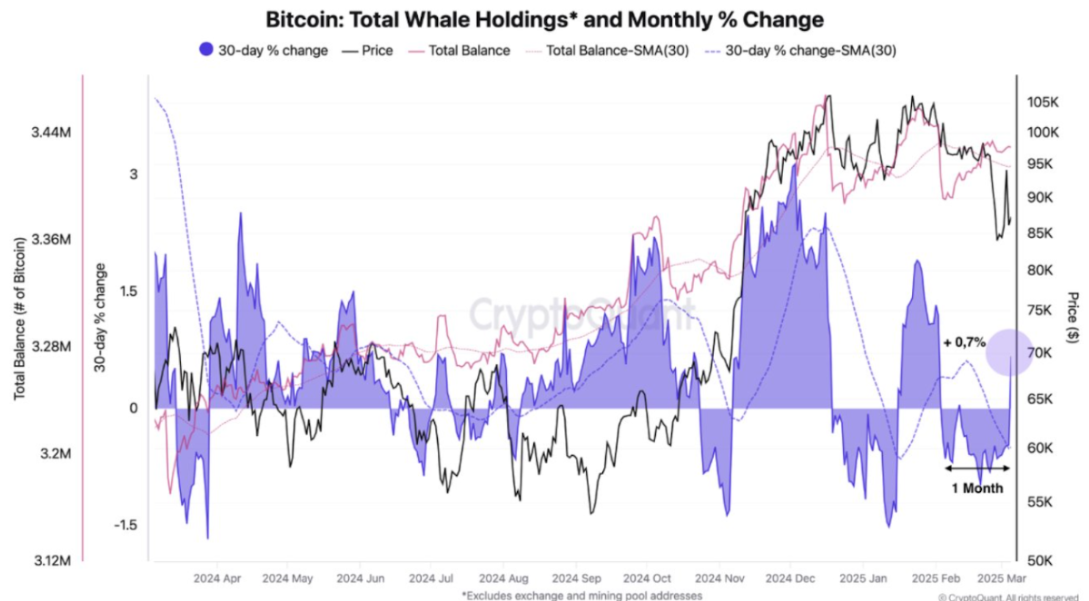
Bitcoin Whales Stack Up as 30-day Growth Signals Recovery
Bitcoin price volatility shows whale accumulation patterns showed a 0.7% surge in whale wallet ownership over the past 30 days ago. Historical patterns of whale accumulation match price recovery trends precisely.
The 30-day moving average (SMA) maintains an unvarying flow while displaying movement in the total whale balance metric.
The analysis of smoothed whale ownership data indicates whale ownership continues to grow steadily.
Meanwhile, Bitcoin price remains in range between $55000-$95000 while traders remain skeptical about market direction.
The heightened whale participation within Bitcoin’s market leads to potential price surge. CryptoQuant data reveals that prior to Bitcoin’s $90,000 price surpass in early 2024 a positive 30-day change trend existed and this trend is currently repeating itself.
BTC whale accumulation shows potential for launching another upward cycle that follows Bitcoin’s traditional patterns through whale investment.
Market Shakeout: Does the Leverage Flush Signal a Buy?
BTC’s Open Interest (OI) experienced a 12% decline during the past seven days showing significant liquidation of leveraged positions.
These forced liquidations trigger positive price movements, which adjusts its position to normalize price patterns in healthier directions.

The yellow markers in the chart reveal past instances of significant Options Open Interest reduction that boosted BTC prices and demonstrate potential accumulation dynamics today.
Historic market data demonstrates the token adopts a stable price before beginning its ascending trend. Bitcoin shows signs of reaching its area-specific price floor prior to another investor purchasing wave.
Bitcoin Price Prediction: Is a Rebound Toward $95k Coming?
On the daily chart, Bitcoin price has retested the 200 day EMA support zone. It seemed hovering around $86k maintaining a delicate balance between its $80k support and $90k resistance levels.
Few of the potential reasons for this bullish speculation is the heightened whale activity and shift in the sentiment from a retracement to a rebound.
Additionally, BTC price action hints that a notable upside rally may be coming in the next few days.

A recent post on X by Ali Charts revealed that the Stochastic RSI was on the verge of a bullish crossover and a potential reversal could be seen in the coming sessions.
Historically, every bullish crossover on the Stochastic RSI has led to a significant price rally in the past three years.
However, it’s worth noting that the BTC price has to defend the 200 day EMA mark for a confirmation of a bullish rebound.
The immediate support zones were $82k and $80k, whereas the resistance zones were $90k and $96k mark.
Disclaimer
This article is for informational purposes only and provides no financial, investment, or other advice. The author or any people mentioned in this article are not responsible for any financial loss that may occur from investing in or trading. Please do your research before making any financial decisions.

Ayesha Malik is a famous sports journalist specializing in cricket and football. She provides in-depth analyses of matches, insights into players, and coverage of important global sports events.